Avem nevoie de ajutorul dumneavoastră pentru a testa traducerea!
Dacă observați erori de traducere, vă rugăm să ne scrieți pe forum despre acestea.
Dacă observați erori de traducere, vă rugăm să ne scrieți pe forum despre acestea.
Sociogram and election graphs
With version 0.8 of the Sociomatrice.Online service, it is now possible to create and print graphs of positive and negative choices.
Positive choices are indicated by a green arrow. Mutually positive choices are indicated by a double-sided bold green arrow.

To assess group activity, one can use these graphs, as well as
sociograms of mutual elections.
In the presence of negative elections in sociometry, one can evaluate a subset of "groupings" within a group and the interactions between them:
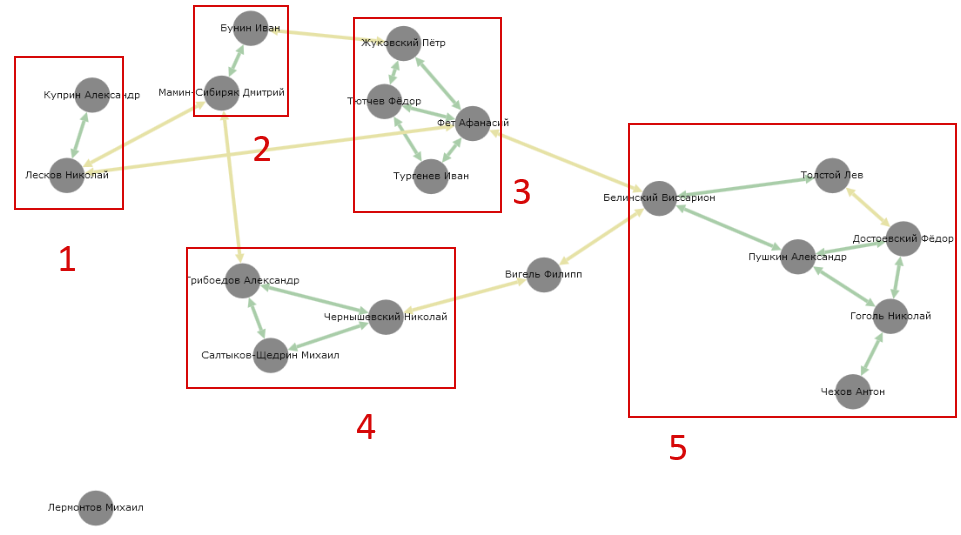

The graph data is printed in a similar manner as described in the help .
You can use your mouse to rearrange the graph for a more readable view: drag and drop subjects with the mouse while holding down the left mouse button.
You can change the scale of the graph by rotating the mouse wheel.
See also:
Sociograms of Mutual Elections
Sociometric Measurement Method/Sociogram